
Much of college work for students hasn’t changed in decades, even centuries. Many professors assign research, writing, computational, laboratory, or even oral presentation exercises as part of their course design. Often, that’s because these methods have enduring value, getting students to practice, perform, create, analyze, assess, and present the concepts and procedures that are the bases for academic disciplines, and lots of work in the world.
However, digital and web-based tools present new possibilities for student work, and these can teach students new communication and creation skills in the process. One of our favorites is the Infographic, a genre popularized by the internet but with ancestors in academic posters, newspaper graphics, and many other print traditions. Here’s an example:
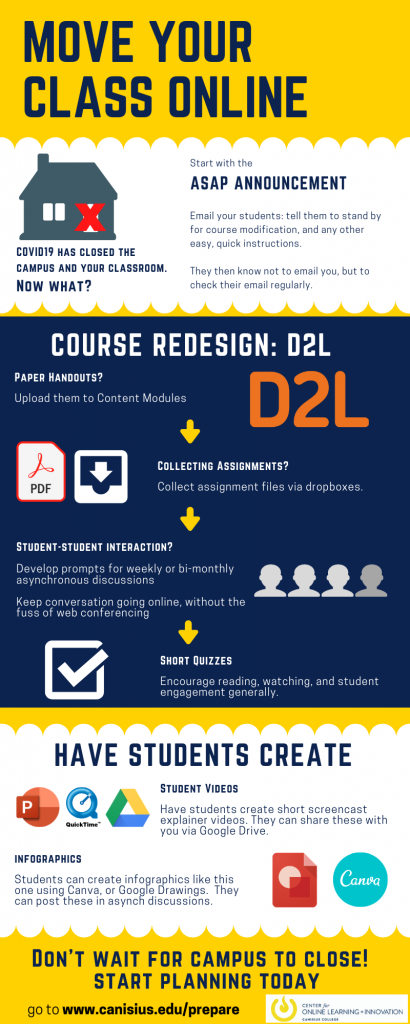
The above infographic was built using Canva, and specifically a free account. Students could make similar, and frankly better graphics that show timelines, procedural workflows or algorithms, mind-maps, geographic (over real maps) representations of historical, social, and cultural concepts, quantitative graphs, and organizational charts. Plus, Canva has tools for interactive presentations, simple logo graphics, and other creations.
Canva isn’t the only option; Google Drawings is built into their Canisius Google accounts, and offers a similar (if simpler) toolset for creating infographics.
In each case, students need to learn to use the tools, but tutorials abound on the web, and part of the assignment can be that students must practice self-efficacy in learning how to create infographics. After they graduate, they’ll need to learn technologies on their own to meet their employers’ objectives; why not start now?
With infographics, students must learn to aggregate various forms of information into graphical summaries. Blending brevity with accuracy is a skill, as well as appropriately representing context and scale for data. An infographic creation assignment can stand alone as an assessment, or compliment lab reports, research papers, business proposals, or other, more traditional assignments.
Try creating a simple infographic yourself, to see if it might be a good fit for your courses.